N3 Noise Loggers
Affordable Temporary Leak Monitoring System
Are you struggling to meet the costs associated with monitoring water leakages across your networks?
N3 Noise loggers from SebaKMT and WaterGroup can be used in a "Patrol Mode" or "lift & Shift mode" to temporarily monitor your water networks for any suspected leaks. The benefits of this system include:
- Lower capital costs (about half as many N3 loggers are required, plus no GSM communication module is required)
- Easier and faster to deploy as there is one device less effort is required for the installation
- Simpler to operate and maintain due to less complexity and more robustness as per the factors explained above
- Lower O&M cost
The trade-off is that leaks are detected within a 250-350 m section only, i.e. traditional leak locating methods, like e.g. manual correlation, will need to be employed for final pinpointing.
How it works
The maximum recommended distance between two noise loggers is 350m, thus with 30 loggers, 10 km of pipeline will be monitored at a time. The N3 noise logger (Fig 1) is installed by magnetically attaching it to a pipe, hydrant, valve, etc (Fig 2).
Fig 1: N3 Loggers
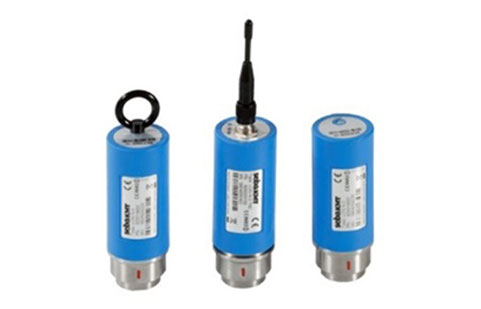 Fig 1: N3 Loggers
 Fig 2: Installation of LogN3
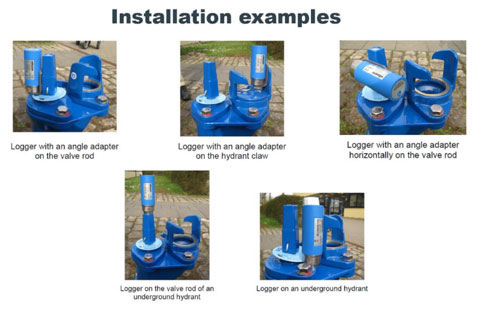 Fig 2: Installation of LogN3
 The logger can be programmed to be in "patrol mode", and the data is collected from these loggers wirelessly via a daily drive-by ("patrolling") without the need of any expensive GSM transmitter.
In the car, there will be a normal laptop with a LogRI+ transmitter connected via USB. During the drive-by, data from these loggers will be collected wirelessly and saved in a Sebadata view software on a laptop.
Every logger successfully read will confirm this with a short beep. Loggers indicating a leak will beep long and will show up in yellow. This allows for an easy audible and visual identification of leak hot spots.
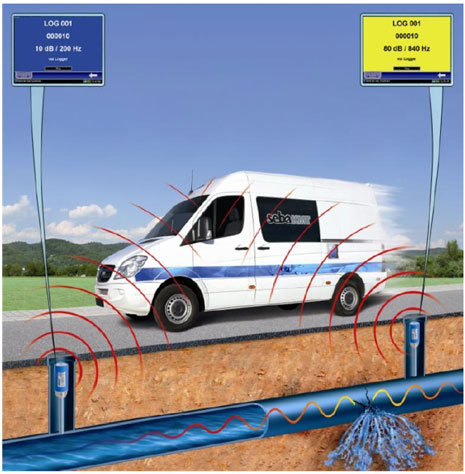 Fig 3: Reading of loggers in Patrol Mode
When the data is collected, it will be saved in the SebaData view program. It can also be sent to the "SebaCloud" for data visualisation in the cloud, e.g. for sharing and discussion of the results with others.
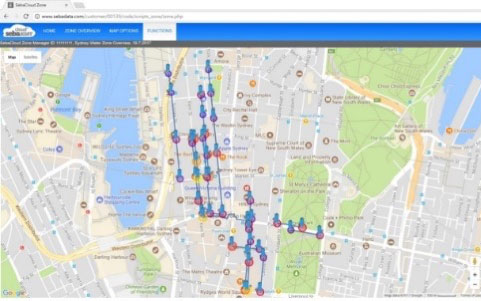 Fig 4: SebaCloud
When a customer is happy with the results and all measurements for the first location are satisfactorily completed and repeatedly confirmed, after a few days, or even 1-2 weeks, the loggers can be removed and deployed at a new next measurement location.
The same N3 noise logger can be programmed to be used in the "lift & shift" mode to localise a leak in any suspected area. The loggers are deployed for one night and then collected the next morning to read the loggers in the office through a Laptop and LogRI+. The Loggers with a high probability of a leak are shown in yellow color as compared to the remaining loggers with a low probability of a leak. The loggers are then deployed in the next section for measurement.
Due to the extended logger placement of up to 350m apart correlation or pinpointing of a leak is no longer possible. Instead, there is visual confirmation via the logger or SebaCloud (Fig 4) of a leak within either side of a logger (Fig 5). Manual leak detection within that section will then be required to pinpoint the leak.
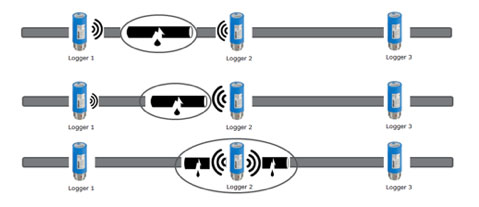 Fig 5: Leak Localisation
Benefits of N3 Noise logging System
- Reduce the risk of large bursts and the disruption and expensive failures caused by them.
- It offers a wide range of analyses, such as the ESA (Enhanced Spectrum Analysis) value or the history function, so that you can track the condition of the network over some time. This means critical sections of the network are easy to identify and nasty surprises are eliminated.
- If the loggers detect a leak, you can query the automatically recorded noise data from the affected measuring points. The noise data is transferred and available to you. You can listen to the recorded noises to confirm if it is a leak or false alarm.
- You can carry out nearly all functions involving the Sebalog N-3 network using a versatile, state of the art application accessible via the internet. In the cloud, you always have an overview of your entire network and can view current and historic measured data and track how the readings change over long periods.